
Skiing with world freeride champion Lorraine Huber, Austria circa 2016
Connecting Dots is the monthly newsletter for innovation leaders by Brett Macfarlane.
◎⁃◎
2026 Innovation Forecast
Introducing the Innovation Confidence Index (ICI)
I’ve long wanted to develop a leading indicator of innovation. The point is to help individuals set goals, prioritize investments and adjust capabilities to succeed.
A challenge is that innovation in action is as much intangible sentiments and behaviours as it is tangible inputs and outputs. However, most people spend most of their time only on the tangible technical factors, yet they report it’s the intangible factors that ultimately determine success or failure.
Hence, in my work on the front lines of technology development and adoption, I’ve always looked for signals of increasing or decreasing innovation tolerance. By reading the climate, you can regulate expectations, resources, and decisions within your teams or in the wider organization.
ICI create a comprehensive measure of innovation confidence by combining sentiment, outputs, and outcomes. As a single index, it can be compared year to year, by region or by industry using reliable economic data and reporting.
ICI 1.0 - 2026 Executive Forecast
The good news is that innovation confidence is generally on the rise in 2026. That’s a preview of what you’ll find below, but first, I’ll properly introduce the index. The analysis was done using Perplexity based on my conceptual model based on core economic principles, and the sources have been cross-checked, giving a strong reassurance of reliability. However, this is a prototype for discussion, not to base any investment decisions on until you do your own analysis.
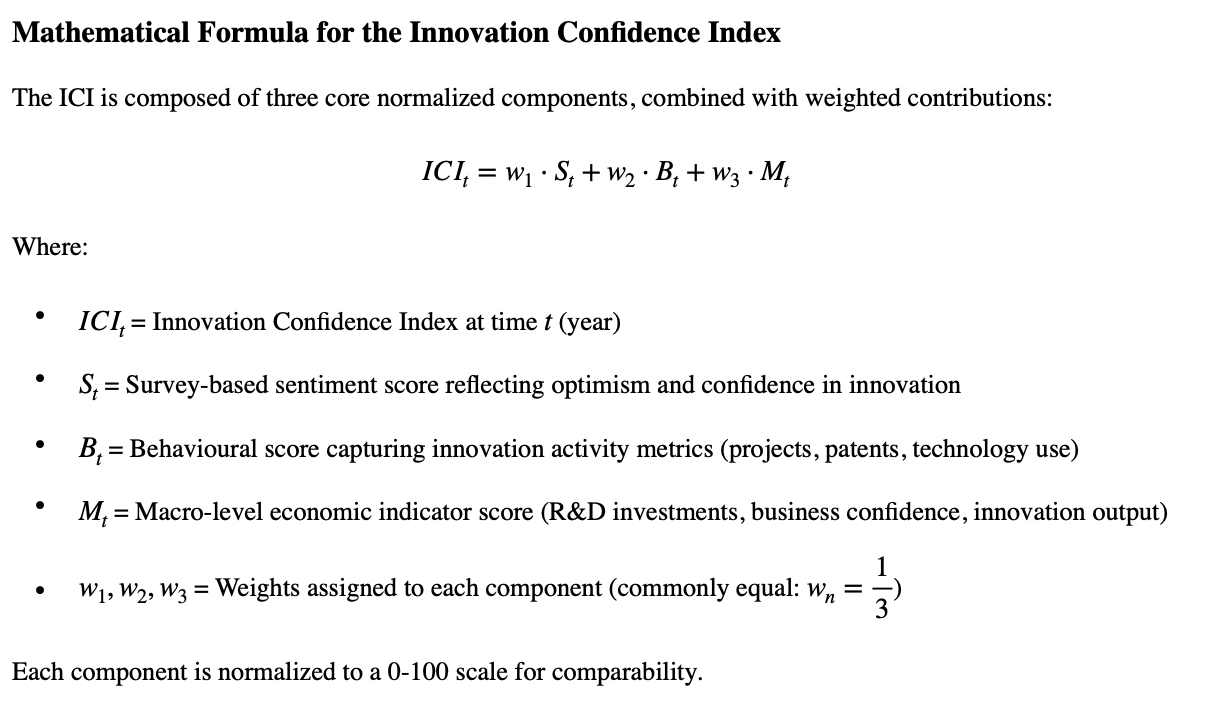
Understanding the Innovation Confidence Index (ICI)
The Innovation Confidence Index (ICI) is a composite economic indicator designed to measure the optimism of employees, leaders, and organizations regarding their ability to generate, implement, and be rewarded for new ideas. It also captures organizational capabilities, technology adoption, innovation activities, and macroeconomic signals that support innovation. The ICI serves as a leading indicator to track the health and momentum of innovation ecosystems over time.
Purpose of the Innovation Confidence Index
The ICI provides insights into the innovation climate by quantifying:
Employee and leader sentiment regarding innovation optimism and confidence.
Organizational capabilities and actual innovation behaviours (e.g., projects launched, patent activity).
Macro-level economic investments and outputs related to innovation (e.g., R&D spending, business confidence).
“More simply, the index combines attitudes, activities and outcomes to tell us how our innovation confidence is changing. ”
This index helps policymakers, business leaders, and researchers understand and anticipate trends affecting innovation productivity and economic growth.
The Working Out
For the economic wonks, what follows is the mathematical model and breakdown by regions globally, as well as an example of the province where I live.
What do you find insightful, useful, or irritating?
Questions and feedback to info@brettmacfarlane.com
Innovation Confidence Index (ICI) Data Sets: 2024–2026 Forecast
| Region |
2024 ICI |
2025 ICI |
2026 ICI (Forecast) |
|---|---|---|---|
| Global |
60.0 |
62.0 |
62.3 |
| USA |
62.4 |
61.7 |
61.0–61.5 |
| Canada |
52.9 |
51.1 |
51.5–52.5 |
| Europe |
58.0 |
58.5 |
59.0 |
Interpretation
Global ICI: Shows a positive trend fuelled by widespread adoption of AI and digital tech, though tempered by economic uncertainties.
USA: Highest ICI, driven by large-scale innovation investment, leadership in technology sectors, but slight softness due to geopolitical and economic challenges.
Canada: Lower and more volatile ICI, reflecting challenges in scaling innovation outputs and fluctuating business confidence.
Europe: Moderate ICI with stable growth thanks to robust innovation policies and diverse industry strengths, poised for slight improvement.
Global Breakdown
| Region |
Year |
(Sentiment) |
(Behavior) |
(Macro) |
ICI Composite Score |
Notes on Data Sources |
|---|---|---|---|---|---|---|
| Global |
2024 |
58 |
61 |
61 |
60.0 |
World Bank, WIPO GII, global innovation surveys, R&D spend reports[1][2] |
| |
2025 |
60 |
62 |
64 |
62.0 |
High-frequency sentiment tracking, patent offices, OECD R&D stats[1][2][3] |
| |
2026f |
61 |
63 |
63 |
62.3 |
Forecasts from global innovation outlooks, business sentiment reports[2][3] |
| USA |
2024 |
65 |
62 |
60 |
62.4 |
US Census innovation surveys, National Science Foundation data, Conference Board business sentiment[4][5][6] |
| |
2025 |
63 |
61 |
61 |
61.7 |
R&D expenditure reports, AI adoption surveys, business confidence indexes[4][7][8] |
| |
2026f |
62 |
61 |
61 |
61.0–61.5 |
Economic forecasts, tech investment outlooks, macroeconomic projections[8][9] |
| Canada |
2024 |
50 |
55 |
53 |
52.9 |
Canadian Innovation Survey, StatsCan innovation data, Bank of Canada business outlook[10][11][12] |
| |
2025 |
48 |
53 |
52 |
51.1 |
GII Canada ranking, innovation outputs, business sentiment surveys[13][12][14] |
| |
2026f |
49 |
54 |
52 |
51.5–52.5 |
Strategic Innovation Fund reports, economic forecasts, surveys[15][16][17] |
| Europe |
2024 |
56 |
58 |
60 |
58.0 |
European Innovation Scoreboard, Eurostat, European business sentiment indices[18][19] |
| |
2025 |
57 |
59 |
59 |
58.5 |
European Commission reports, patent filings data, economic outlooks[18][20] |
| |
2026f |
58 |
60 |
59 |
59.0 |
Policy outlooks, investment trend forecasts, innovation ecosystem studies[20] |
British Columbia Innovation Confidence Index (2024-2026)
ICI for the Canadian province of British Columbia.
Pupulation: 5.7 million
GDP: $427B CAD / $305B USD / £230B GBP / €264B EUR
Comparable-sized economies: Finland, Greece, Nigeria, Portugal, New Zealand
| Year |
Sentiment (S) |
Behavior (B) |
Macro (M) |
Composite ICI |
Yearly Highlights |
|---|---|---|---|---|---|
| 2024 |
49 |
52 |
51 |
50.7 |
Modest optimism amid economic challenges; investment in digital infrastructure begins |
| 2025 |
47 |
53 |
50 |
50.0 |
Slightly softened sentiment due to global uncertainties; steady innovation programs maintained |
| 2026f |
48 |
54 |
51 |
51.0 |
Recovery signs with expanded AI initiatives and clean technology projects impacting confidence |
Interpretation
BC’s innovation confidence remains stable around a mid-level range.
Innovation programs targeting AI and sustainability are key drivers of behaviour improvements.
Economic headwinds affect sentiment but investment continuity supports a mild rebound forecast.
Top 20 Industries in British Columbia: Innovation Confidence Index (2024-2026)
| Clean Technology |
58.0 |
59.3 |
60.0 |
BC’s cleantech leadership with strong government and private investment |
|---|---|---|---|---|
| Artificial Intelligence |
54.5 |
57.7 |
59.7 |
Growing AI ecosystem, innovation driven by startups and policy |
| Software and IT Services |
53.0 |
55.7 |
57.0 |
Mature digital sector with steady innovation advances |
| Biotechnology and Life Sciences |
52.0 |
54.3 |
55.2 |
Health innovation and increasing R&D funding |
| Advanced Manufacturing |
51.0 |
53.3 |
54.5 |
Industry 4.0 adoption growing |
| Financial Services |
50.0 |
52.3 |
53.5 |
Fintech innovations supported by venture capital |
| Natural Resources & Mining |
48.3 |
50.0 |
50.5 |
Sustainable resource management innovations |
| Professional Services |
49.0 |
50.0 |
50.7 |
Adoption of AI and digital tools |
| Construction & Engineering |
47.5 |
49.0 |
49.5 |
Smart and green building technology adoption |
| Transportation and Logistics |
46.0 |
46.3 |
46.8 |
Electrification and supply chain digitization |
| Agriculture and Food Production |
45.2 |
47.3 |
47.8 |
Emerging agtech applications |
| Educational Services |
44.0 |
45.3 |
46.0 |
Growth in digital and remote learning innovation |
| Retail and Wholesale Trade |
43.0 |
44.3 |
44.7 |
E-commerce and retail tech adoption |
| Tourism and Hospitality |
42.0 |
43.3 |
43.8 |
Slow digital adoption, emerging customer experience innovations |
| Health Care Services |
43.5 |
45.0 |
45.6 |
Expansion of telehealth and digital diagnostics |
| Arts, Entertainment and Recreation |
41.7 |
42.3 |
43.0 |
Digital content production growth |
| Real Estate and Rental |
40.3 |
41.3 |
41.9 |
Use of PropTech and smart building innovations |
| Information Media & Telecommunications |
49.5 |
50.7 |
51.3 |
Expansion of data and cloud infrastructure |
| Public Administration |
38.5 |
40.0 |
40.7 |
Digital transformation in government services |
| Waste Management & Remediation Services |
39.0 |
39.7 |
40.2 |
Innovations in environmental tech and waste processing |
| Waste Management & Remediation Services |
39.0 |
39.7 |
40.2 |
Innovations in environmental tech and waste processing |
Summary
The Innovation Confidence Index offers a comprehensive, multi-dimensional lens on innovation momentum across geographies and industries.
Globally and across major regions, innovation confidence is generally on the rise, led by strong policy support and technology advances.
British Columbia maintains stable innovation confidence supported by focused investment in AI, cleantech, and digital sectors.
Sectoral breakdown highlights cleantech and AI as leaders within BC’s economic landscape with opportunities for growth in manufacturing, biotech, and professional services.
This analysis informs strategic decision-making for governments, businesses, and innovation leaders as they navigate evolving opportunities and challenges heading into 2026.
*This is a prototype and is only intended for discussion and exploration of your own models and interpretations.
Select Sources:
https://www.wipo.int/web-publications/global-innovation-index-2025/en/gii-2025-at-a-glance.html
https://www.wipo.int/web-publications/global-innovation-index-2025/en/global-innovation-tracker.html
https://www.ibisworld.com/united-states/bed/business-sentiment-index/88232/
https://www.ey.com/en_us/insights/strategy/macroeconomics/us-economic-outlook
https://chamber.ca/news/canadian-businesses-close-the-year-with-waning-optimism/
https://www.bankofcanada.ca/2025/10/business-outlook-survey-third-quarter-of-2025/
https://www.goldmansachs.com/insights/articles/what-is-the-us-economys-potential-growth-rate
https://www.startus-insights.com/innovators-guide/global-megatrends-full-guide/
◎⁃◎
Learn more about how to develop impactful innovation leaders.